Energy analysis confirms: No new fossil fuels needed to replace Indian Point
View more images on our Flickr site
New Synapse report details how solar, wind and energy efficiency improvements will fill gaps left by nuclear power plant
A new report prepared for Riverkeeper by Synapse Energy Economics provides updated projections on energy production with the retirement of the Indian Point Energy Center, which ceased operation on April 30, 2021.
The report’s findings confirm that a combination of solar, wind, and energy efficiency improvements are on track to replace Indian Point’s energy production by 2022. Additionally, the report found no need for new fossil-fuel plants like Danskammer or environmentally damaging Canadian hydropower to help replace Indian Point. Wind and solar sources alone will generate nearly twice the amount of power that Indian Point produced by 2025, and nearly three times that amount by 2030.
Clearly, New York’s energy future rests with renewables – not with dirty fracked gas plants or destructive megadams.
Read on for an overview of the Synapse report’s findings, or download the complete report here.
The planned retirement of the Indian Point Energy Center (IPEC) in April of 2020 (Unit 2) and April of 2021 (Unit 3) was announced in January 2017.[1] Five months earlier, New York’s Clean Energy Standard (CES) Order was issued by the New York Public Service Commission (NY PSC),[2] in which accelerated renewable energy installation (50 percent by 2030) and aggressive pursuit of energy efficiency goals were a centerpiece. Subsequently, the NY PSC adopted specific and strengthened energy efficiency targets,[3] including annual energy reductions from energy efficiency of 3 percent of electricity sales by 2025. Then in 2019, New York passed the Climate Leadership and Community Protection Act (CLCPA), which boosted the renewable energy target (to 70 percent by 2030) and further codified the energy efficiency aims from the CES and accelerated energy efficiency adoption Orders.
This is the temporal framework and energy policy context in which we now assess how these zero-carbon emitting alternative energy sources—efficiency and renewable resources—stack up against the output level of the IPEC facility when it was operating. In this report we examine what has occurred in New York in the 4.5-year interval (2017– 2021) since the IPEC retirement announcement and what is projected to occur as new renewables come online and efficiency gains accumulate (through 2035). When analytically appropriate, we look back to 2011 (and even to 2004) to capture the broader replacement energy trends that have been at work in New York since at least a decade ago.[4] In particular, we utilize New York State Department of Public Service (DPS) data on energy efficiency savings through utility program efforts from 2011 through the present, and projected to 2025, to inform our assessment.[5]
IPEC, when it was online, produced roughly 16–17 million MWh (or, TWh) per year, with variations depending on the refueling cycle effects and its performance. New York State’s now-aggressive stance in acquiring all cost-effective energy efficiency resources has resulted in an annual cumulative reduction of total electricity consumption in New York that will reach 16.7 TWh—fully displacing IPEC output—by 2023, when counting energy efficiency installations that commenced in 2011.[6] As we further document in this report, NYISO data (vintage 2004 and later) indicates more broadly that actual exceedance of IPEC output from energy efficiency resource deployment alone has likely already occurred in New York State.
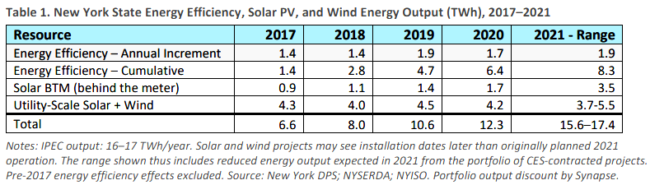
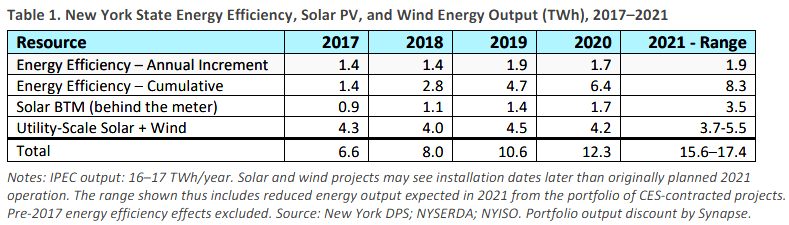
Considering only the accumulated energy efficiency improvements from 2017 forward (after the IPEC retirement announcement), incremental energy efficiency gains over five years reach 8.3 TWh/year by the end of this year (2021). Solar PV and wind installations in New York produced roughly 5.9 TWh per year in 2020, but output including new solar and wind resources is expected to increase to more than 10 TWh/year by the end of 2022.[7] We note that 2021 output levels depend on the success of projects currently under development that have been delayed in part due to permitting issues. We estimate production of total solar and wind resources in New York installed by the end of 2021 will range from 7.2 to 9.0 TWh/year, with the total solar, wind, and incremental energy efficiency output roughly equaling the production of IPEC pre-retirement. Table 1 below summarizes the energy efficiency and renewable energy resource outputs in the 2017–2021 timeframe.
- Energy efficiency resources installed in New York since the announced IPEC closure in 2017 will displace half of IPEC output by the end of this year. Coupled with wind and solar PV resources, this clean energy fully displaces IPEC output in 2021 or 2022.
- Annual reductions in New York load from energy efficiency resources alone, obtained through NYSERDA and utility sponsored efforts since roughly 2009 already exceed IPEC’s annual output.
- Energy efficiency and small solar PV are the main drivers behind a 2,865 MW reduction of grid peak load in 2021 from that forecast a decade ago. This amounts to roughly 1.4x the capacity provided by the IPEC units when operating. o The projected summer 2021 peak load is 1,540 MW lower than the actual peak load on the grid in 2011, even as New York State’s economy has steadily grown.
- New York’s onshore and offshore wind, and solar PV energy (existing plus CLCPA-driven) will reach 1.7 times IPEC’s annual output by 2025, and more than 2.7 times its output by 2030. This is distinct from the energy efficiency contributions noted above.
- Natural gas use for electricity generation in New York will continue its declining trend (maximum was in 2012) even after IPEC closure as energy efficiency and renewable output steadily reduce ongoing needs for energy from fossil fuels – even when considering electrification needs.
Projected deployments of additional wind and solar PV energy in New York State coupled with existing wind and solar resources will reach roughly 1.7 times the annual output of IPEC by 2025, and more than 2.7 times its annual output by 2030. Additional other renewable energy is provided by New York’s hydroelectric resources, and by current imports of energy from Quebec.
Figure 1 below shows the broad pattern of electric energy resource deployment in New York State between 2011 and projected to 2035. It illustrates that output patterns for natural-gas-fired energy (along with import energy) have been of a similar magnitude for the past decade but will continue to shrink in output relative to its peak year production (2012, 62 million MWh), IPEC retirement notwithstanding, through 2035. The dominant drivers of the overall longer-term pattern of natural gas use for electricity production in New York will continue to be the effect of energy efficiency deployments, and now renewable energy deployments under the CLCPA. With strengthened policies in both the energy efficiency and renewable energy arena, natural gas use for electricity production will continue to decline over the next decade and beyond.
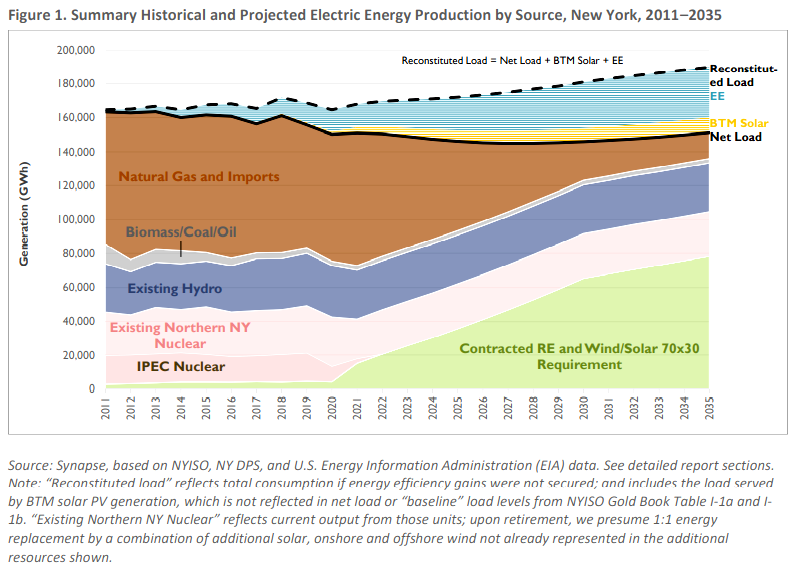
Figure 2 shows the consumption of natural gas for in-state electricity production between 2011 and 2020, with projected consumption for 2021 through 2035.
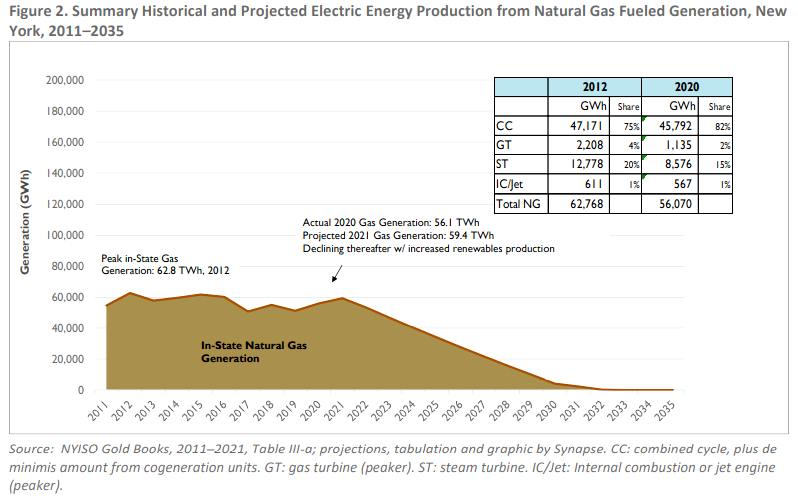
As seen in Figure 2, natural gas use for electricity production peaked in 2012 in New York, with an aggregate output of roughly 62 TWh across various types of thermal resources. While one expected near-term effect of IPEC’s closure is an increase in marginal energy from gas resources,8seen by comparing 2019 and 2021 (expected) values for gas-fired generation, the overall trend is one of continuing reduction of aggregate electricity production from natural gas fuels as efficiency and renewable sources continue to displace the need for fossil-fueled electricity.
Newer combined cycle plants such as Cricket Valley and CPV Valley also contribute to steady declines in production at older, less efficient and more highly emitting units such as steam plants, gas turbines, and older combined cycle units.[9] The insets in Figure 2 and Tables 3 and 4 in Section 3 of this report illustrate that one of the results of the commencement of operation at those two newer combined cycle power plants is a reduction in production at older gas-fired steam and gas turbine plants in New York, and also a reduction of output at older gas-fired combined cycle facilities. The 2020 output from the Cricket Valley and CPV Valley plants combined (about 8.8 TWh) has displaced output from older, less efficient gas plants.[10]
Back to top >
[1] NY.gov. 2017. “Governor Cuomo Announces 10th Proposal of the 2017 State of the State: Closure of the Indian Point Nuclear Power Plant by 2021.” Press Release, January 9. Available at: https://www.governor.ny.gov/news/governor-cuomo announces-10th-proposal-2017-state-state-closure-indian-point-nuclear-power.
[2] New York Public Service Commission, Order Adopting a Clean Energy Standard, Case 15 15-E-0302 and 16-E-0270, August 1, 2016.
[3] New York Public Service Commission, Order Adopting Accelerated Energy Efficiency Targets, Case 18-M-0084 – In the Matter of a Comprehensive Energy Efficiency Initiative. December 13, 2018.
[4] New York Public Service Commission, Order Instituting Proceeding and Soliciting Indian Point Contingency Plan, Case 12-E 0503, November 30, 2012. This Order commenced assessment of the reliability aspects of IPEC’s closure.
[5] We also extrapolate the effect of energy efficiency gains after 2025, assuming continued support for procurement of “all cost effective” energy efficiency resources.
[6] See Section 2 of this report.
[7] Several relatively large (on the order of ~100 MW, or larger) wind and utility-scale solar facilities are in advanced developmental stages in New York, with initial operation dates slated for 2021, but with likely in-service dates of 2022 or later.
[8] See Section 3 of this report.
[9] For example, in 2012, New York’s peak year for gas use for electricity production, older steam and gas turbine plants, and other peaking units made up 25 percent of the total natural gas produced electricity. By 2020, that share had declined to 18 percent. See inset to Figure 2 (data from Table III-2 of the 2021 NYISO Gold Book).
[10] Reduced collective output at natural-gas-fired steam plants in New York between 2012 and 2020 was 4.2 TWh; reduced output at gas turbines and other peaking resources across the same time period was 1 TWh; and at remaining combined cycle units, more than 10 TWh. [NYISO Gold Book data, Table III, comparing 2020 to 2012]. This reduction in annual electricity production exceeds the output seen at the CPV and Cricket Valley Plants in 2020. Back to top >